Back to: Structural Analyst
Once one develops the SN curve, one can proceed to electing a fatigue model to estimate the life expectancy of a part. The simplest and one of the more conservative models is the Soderberg fatigue model. All one needs to develop a Soderberg fatigue model is (1) an SN-curve and (2) the yield stress (![]() ) of the material that makes up the component. Because of it’s simplicity and conservative nature, we will apply this fatigue model in determining the life expectancy of the Gondola bent arm.
) of the material that makes up the component. Because of it’s simplicity and conservative nature, we will apply this fatigue model in determining the life expectancy of the Gondola bent arm.
STEP 9: Develop a fatigue diagram
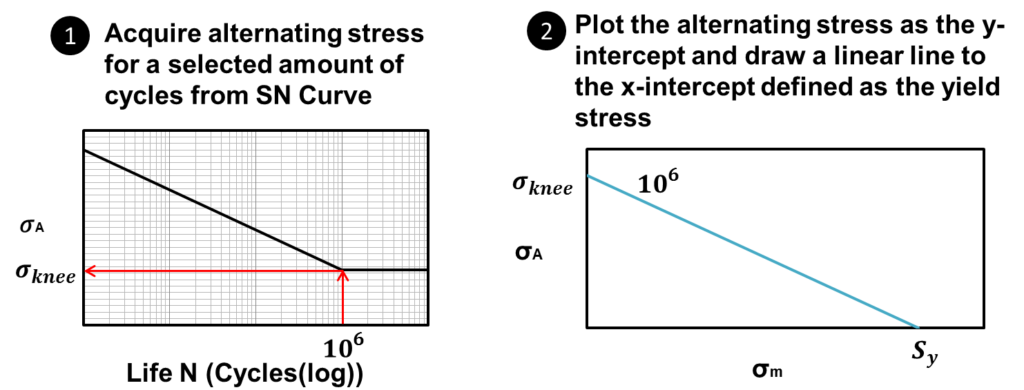
The general procedure to develop a Soderberg fatigue diagram is illustrated in the figure below:

Essentially what one does is (1) select a number of cycles one is interested in and (2) go to the SN curve and determine the alternating stress at the selected number of cycles. Then one (3) plots the alternating stress as the y-intercept on a fatigue diagram and (4) linearly extrapolates to the yield stress (![]() ). One can do this for one or more selected cycles, but the key point for a Soderberg failure diagram is they all get extrapolated to the yield stress on a fatigue diagram. For our example, we will develop a fatigue diagram for
). One can do this for one or more selected cycles, but the key point for a Soderberg failure diagram is they all get extrapolated to the yield stress on a fatigue diagram. For our example, we will develop a fatigue diagram for ![]() cycles because this point is at the endurance limit (a.k.a the knee) on the SN curve. If we use the alternating stress at the endurance limit, we can plot it on a fatigue diagram and compare it to our operating point. If the operating point falls below the line, the component theoretically should never fail. If it falls above the line, then the component is predicted to fail. With this background information, one should be able to proceed with the failure analysis for this example.
cycles because this point is at the endurance limit (a.k.a the knee) on the SN curve. If we use the alternating stress at the endurance limit, we can plot it on a fatigue diagram and compare it to our operating point. If the operating point falls below the line, the component theoretically should never fail. If it falls above the line, then the component is predicted to fail. With this background information, one should be able to proceed with the failure analysis for this example.
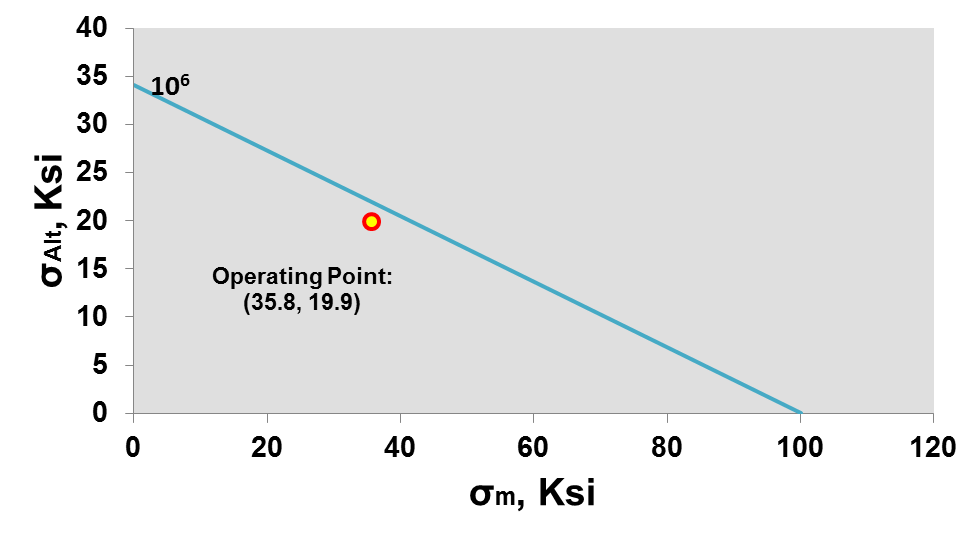
From Part 4 the alternating stress at the endurance limit was determined to be 34 ksi. From Part 3, the operating point was determined to be (![]() )= (35.8 ksi, 19.9 ksi). We will assume that the material has a yield stress (
)= (35.8 ksi, 19.9 ksi). We will assume that the material has a yield stress (![]() ) equal to 100 ksi. Acquiring those three pieces of information, the fatigue diagram at
) equal to 100 ksi. Acquiring those three pieces of information, the fatigue diagram at ![]() can be developed. The plot below compares the Soderberg fatigue model at
can be developed. The plot below compares the Soderberg fatigue model at ![]() cycles to the operating point :
cycles to the operating point :

From the figure above it should be clear that the operating point falls below the fatigue line. This suggests at the current loading condition, the Gondola bent arm will never experience failure. This is great news!! This means that the engineer that designed the bent arm designed it safely. In some cases, your boss might be interested in a safety factor. So how does one calculate a safety factor using a fatigue diagram?
STEP 10: Determine a factor of safety
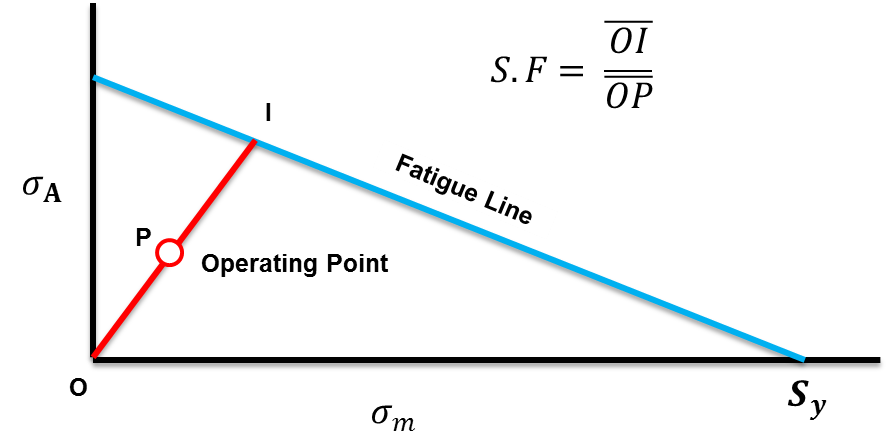
There are a few ways to determine the factor of safety from a fatigue diagram. I like to use the following interpretation of the safety factor because as you increase or decrease the load, the operating point tends to follow closely to a linear line through the operating point and the origin. A visual of how the safety factor is calculated is illustrated below:

As illustrated above, the safety factor is determined by the ratio between the lengths of two lines: (1) one that intersects the fatigue diagram and (2) one that intersects the operating point. The Line that intersects the operating point and the fatigue line goes through the origin. Using algebra, this can be determined. I won’t go into the math here, but the safety factor from the fatigue failure analysis of the Gondola arm using this interpretation of safety factor was calculated to be 1.06.
That’s it! The fatigue failure analysis is complete. In summary, the fatigue analysis was solved using the following steps:
- Draw a free body diagram and determine the forces acting on the member of interest
- Make a cut and determine the internal forces at the location of interest
- Determine the worst case stress location and its resulting stress
- Determine a minimum and maximum stress
- Determine the mean and alternating stresses i.e. the operating point
- Gather the data necessary to build an SN Curve empirically
- Empirically derive the ideal SN-Curve
- Empirically derive the SN-Curve from fatigue strength factors
- Develop a fatigue diagram
- Determine a factor of safety
The steps described above is a template that can solve the majority of fatigue problems. Some other types of problems may be a slight deviation from the steps above, however this is a great starting point for solving fatigue failure analysis problems.
Please inform me it labored proper? I dont wish to sumit it again if i would not have to! Either the blog glitced out or im an idiot, the second option doesnt shock me lol. thanks for an ideal blog! Anyway, in my language, there are not much good source like this.